
Run the whole site from one live map
Auramesh is a digital twin console for manufacturing, energy and mining sites. Fixed assets, mobile fleet, telemetry, compliance and production in one place, on real terrain, updated every second.
One twin, three kinds of site
The same registry, telemetry and rules serve a factory, an energy site and a pit. What changes is the asset list, the standards each one answers to, and the numbers it watches.
Manufacturing
Plant, utilities and the ground around the line: a registry down to the individual machine, PLC or SCADA readings carried over the same broker, threshold alarms that write themselves into the audit trail, mechanical integrity inspections, work orders, and MTBF and MTTR per unit. Restricted zones cover yards where vehicles and people share space.
Energy
Substations, generators, solar arrays, chargers and what depends on them. The running console already carries these as assets with live electrical load and utilization, a dependency graph between them, and a what-if that walks the cascade out from one substation marked offline.
Mining
Pit, fleet and water in one picture: a 3D pit on open elevation data, a one-second fleet feed with haul cycles and output against plan, blast windows and zones that travel with a machine, settling-pond turbidity and pH, and ten years of the ground from satellite composites.
What the live console demonstrates today is an industrial estate, including its substation, solar array and chargers, together with a simulated open-pit mine. A manufacturing line is the one of the three not yet in the demo; a pilot supplies that feed.
From a sensor on the ground to a decision in the control room
The field side publishes. The platform ingests, checks the rules and keeps the record. Nothing in between is a nightly export.
The publisher and the ingest service never call each other directly: they meet on the broker, which is what lets a real gateway or fleet management feed replace the demo publisher without touching the platform side.
One second, not one shift
Fixes and readings land as they happen, so the map shows the site as it is now, and every threshold crossing is written down as it happens.
Rules the site already has
Blast windows, hazard buffers, speed limits and pre-start checks are modeled as they are written, not bent to fit a generic asset tool.
Numbers with a source
Tonnes, cycle times, MTBF and risk scores are computed from the same records you can open, not typed into a summary sheet.
A running console, not a prototype deck
Everything below is captured from the deployment anyone can open. The terrain, imagery, building footprints and BIM are real data; the operation running on them is simulated until a pilot supplies its own.
Copernicus and Sentinel-2
Terrain from the Copernicus DEM, imagery from Sentinel-2, and ten annual composites built from public scenes. Credits are in the footer.
11 inspection programs
NFPA 101, API 510 and ASME A17.1, NFPA 70B, ISO 55001, ISO 45001, Kepmen ESDM 1827 and KepMen LH 113/2003.
0.97 ROC-AUC
A RandomForest fitted on a public industrial sensor dataset, reported on a held-out split, scoring live risk per asset.
Same site, two ways of seeing it
Ten systems and a spreadsheet
- Fleet lives in the FMS, sensors in SCADA, inspections on paper
- The pit is a survey from last month, the plan is a PDF
- A breach is a radio call, and the record of it is a memory
- Every number is re-keyed before anyone can act on it
One map, one record
- Fleet, sensors, zones and assets share one live picture
- Ten years of the ground behind it, from open satellites
- A breach raises a near-miss, names the camera and reaches a webhook
- Tonnes, cycle times and reliability come from the same trail
What the console does on day one
Six panels that already run on the live deployment, on an industrial estate and on a simulated open-pit mine.
Every machine on the map, once a second
Trucks, excavators, dozers, drill rigs, light vehicles and a survey drone report a GPS fix over MQTT and move as 3D models over real elevation data, with speed, payload and haul-cycle state.
units streaming GPS into geofence checks
Each fix is evaluated against every armed zone before it is stored, so a breach is caught on the fix that caused it.
A breach that reaches someone
Alerts queue for acknowledgement, name the CCTV camera that covered the spot, log a near-miss on their own, and go out on a signed webhook with retries that survive a restart.
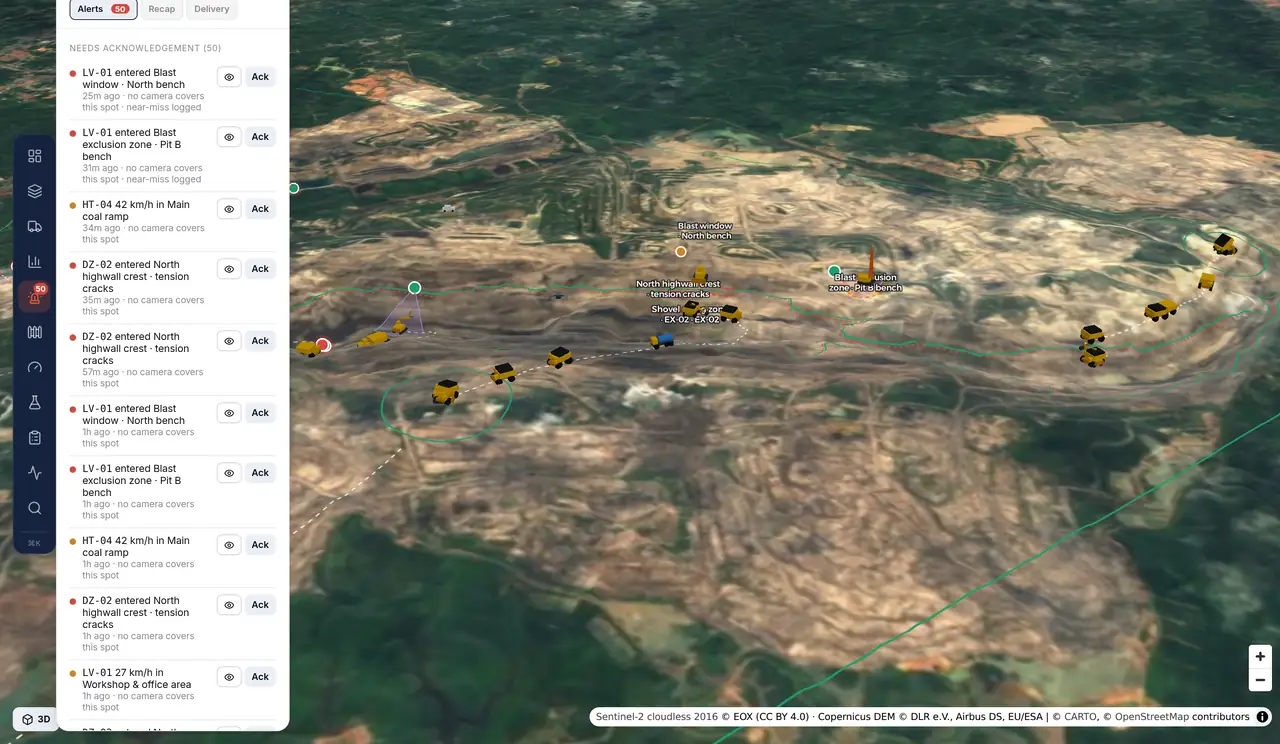
Zones that match how the site runs
Exclusions, hazard buffers and speed-limited roads are checked against every fix. A zone can arm only inside a blast window, or travel with the machine it protects.
Production against plan
Output per material against the daily plan, loads, average cycle time and utilization, with each cycle split into load, haul, dump, return and queue.
Telemetry with a trail
Equipment temperatures, electrical load, tank and sump levels, pond turbidity, pH and drainage flow arrive over a real broker, and every threshold crossing is timestamped.
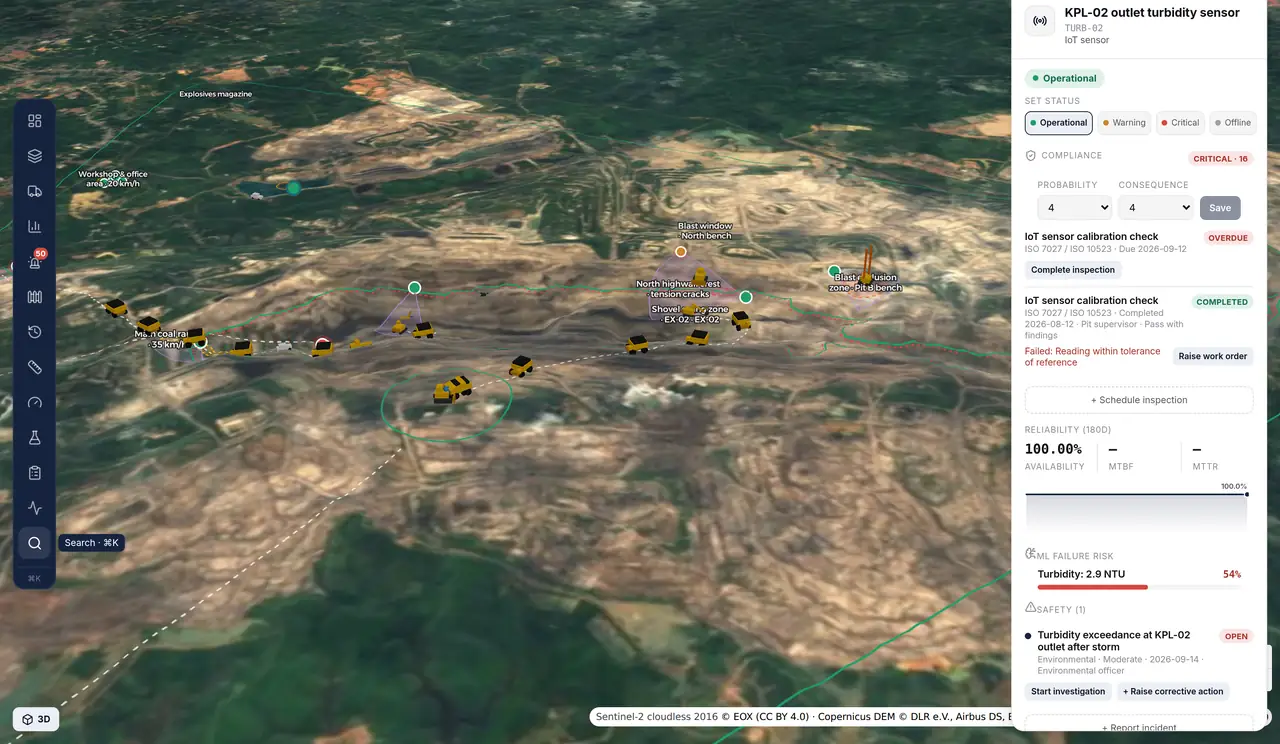
Water and environment
Settling-pond turbidity and pH, drainage flow, sump level and rainfall against thresholds, with pond and drainage inspections attached to the asset.
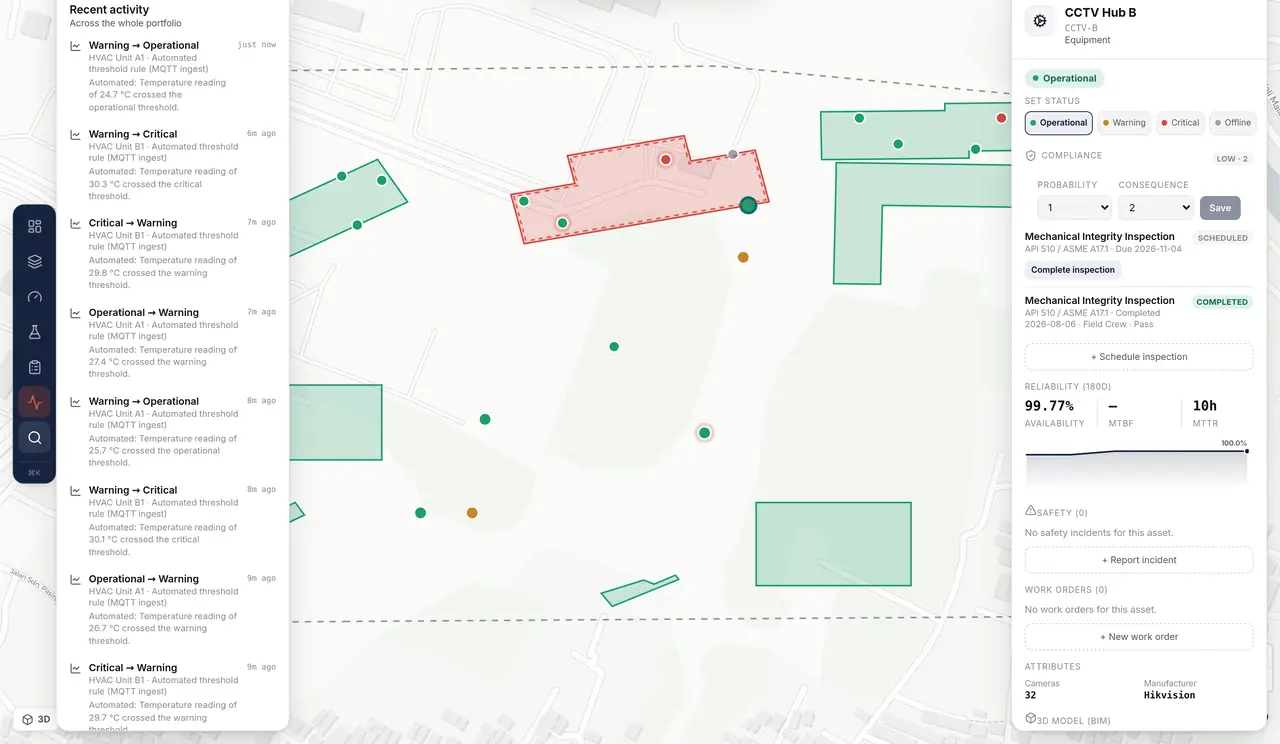
Registry and compliance
A hierarchy down to individual equipment, each item carrying inspections, work orders, MTBF and MTTR, and its 3D or BIM reference.
Built since the console went up
Four phases landed on the live deployment after this page was first written. Each one is on the same site anyone can open.
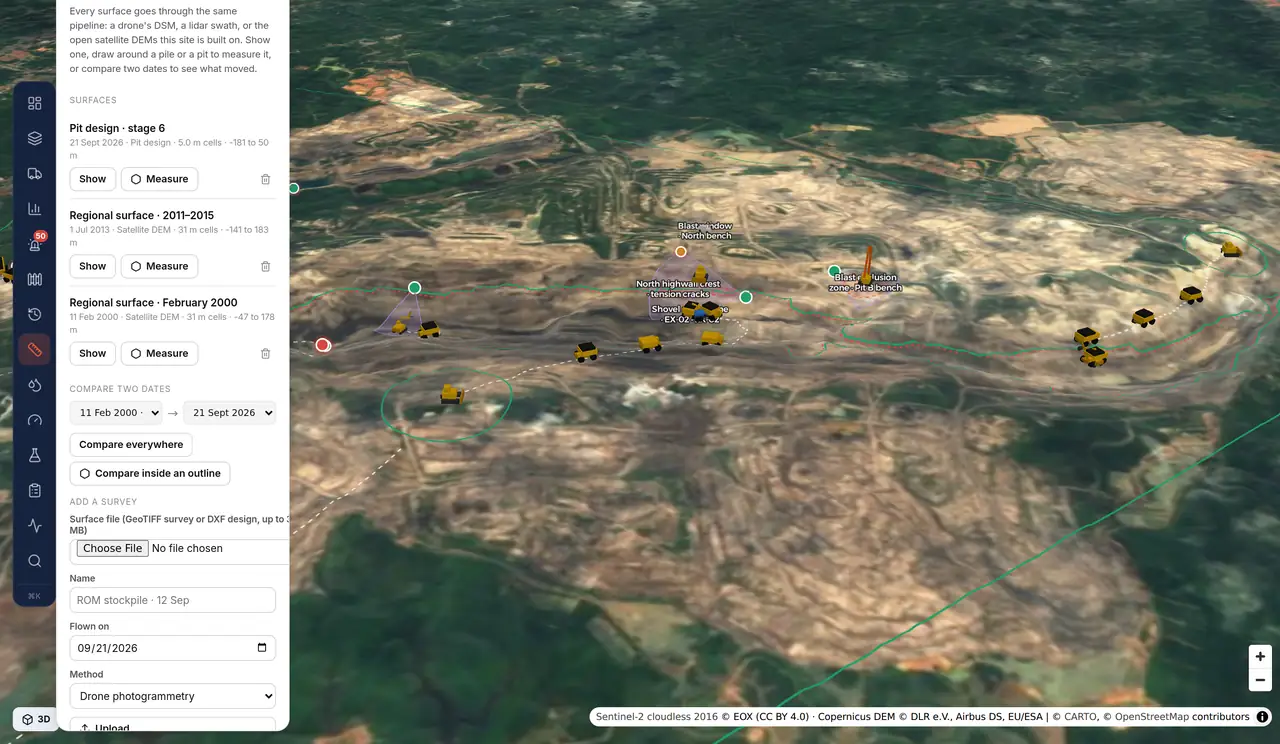
Survey surfaces, and design against actual
A drone DSM, a lidar grid, a satellite DEM and a DXF design all land as the same kind of surface. Draw an outline to measure a stockpile or a cut, or compare two dates to see what moved.
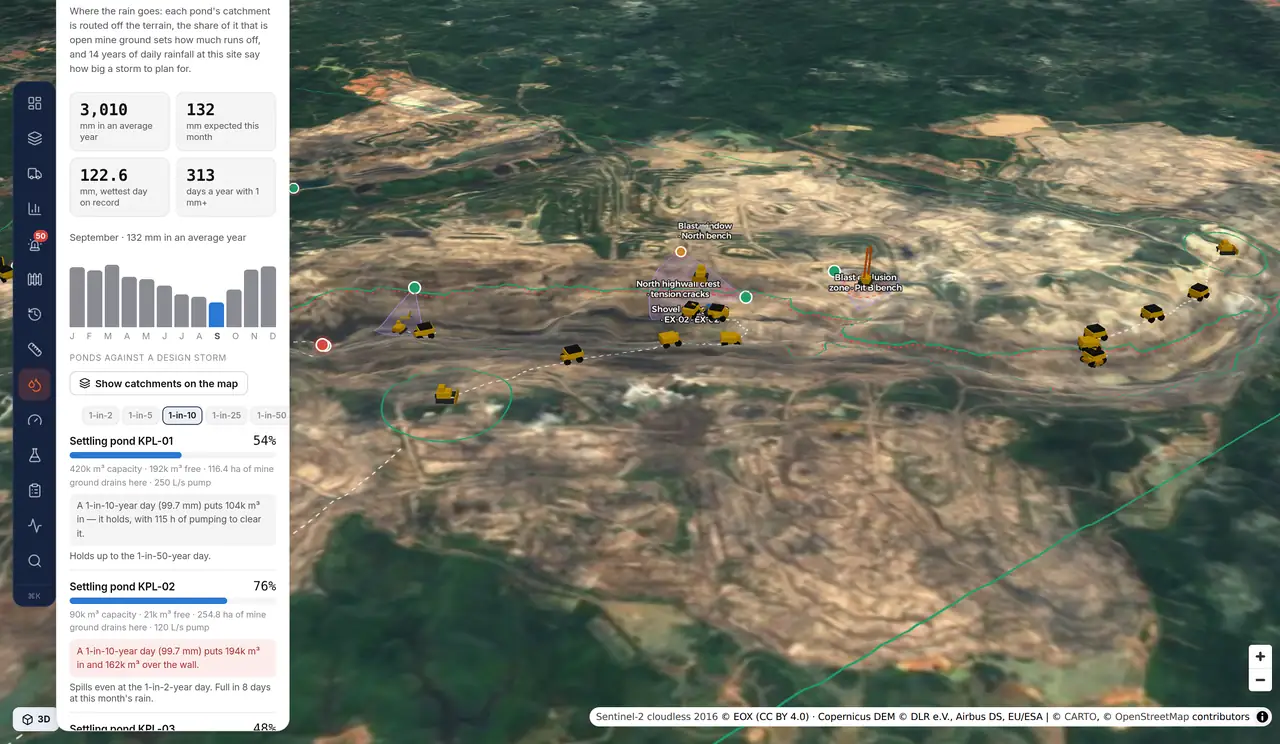
Where the rain goes, and what the ponds can take
Each pond's catchment is routed off the terrain, the share of it that is open mine ground sets the runoff, and fourteen years of daily rainfall set the design storm. Every pond reports free capacity, the pumping hours to clear it, and the storm it stops holding.
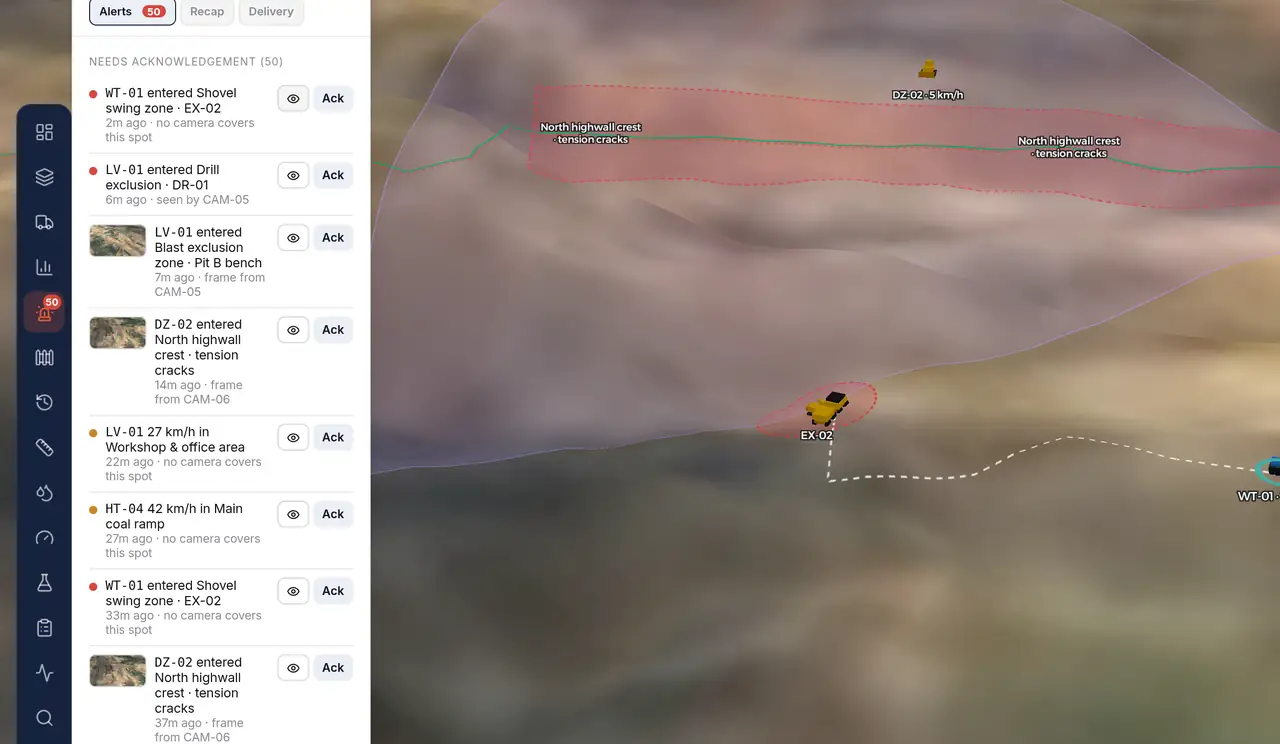
A frame from the camera that saw it
When a breach falls inside a camera's field of view, a frame is pulled from its stream, whether that is RTSP, an HLS playlist a VMS already publishes, or a bundled clip on the demo, and filed against the event so the alert carries the picture.
What runs today, and what is being built
The first list in each group runs in the console now; the second is under construction for the first pilot deployments. Pilots decide the order.
- 3D pit on real elevation data, with grade-limited haul roads
- Ten years of annual satellite composites, and the elevation change behind them
- Dated survey surfaces: stockpile and cut volumes from an outline, and cut and fill between two dates
- A pit design read from a DXF export and compared against the ground as a surface
- Surface upload from GeoTIFF or DXF, including a drone DSM or a lidar grid
- Benches, cross-sections, contours and slope analysis
- Block model with coal quality (CV, ash, sulfur) and stripping ratio
- 31 units on a one-second GPS feed over MQTT, with haul cycles closed automatically
- Tonnes against the daily plan, cycle time and utilization per unit and contractor
- Connectors to real telematics and FMS feeds: VisionLink and ISO 15143-3, KOMTRAX, FMS APIs
- Dispatch: assigning trucks to excavators, queueing and re-assignment
- PA and EU, delay codes with reasons, per-shift targets, distance travelled
- Fuel, hour meters, operators and rosters
- Real drilling: hole patterns, depth, penetration rate and hole status
- Shift replay, and export to Excel and PDF
- Zones per equipment class, blast windows on a schedule, zones that follow a unit
- Breach and overspeed alerts with camera coverage, near-miss logging and signed webhooks
- Rules per unit and per operator, not only per equipment class
- Delivery straight to WhatsApp, email and Teams, with escalation
- Duration and peak speed recorded on every event
- Pond turbidity and pH, drainage flow, sump level and rainfall against thresholds
- Pond and drainage inspections on KepMen LH 113/2003
- Pond catchments routed off the terrain, runoff from open mine ground, and fourteen years of daily rainfall behind a design storm
- Real field devices, with calibration records and flat-line and spike detection
- NTU to TSS conversion, and lab results entered against the sensor
- SPARING KLHK and RKL-RPL reporting
- A survey drone flying its pattern over the pit, tracked like any other unit
- Cameras with real field-of-view geometry, and the camera that covered a breach
- A frame pulled from the camera that covered a breach, over RTSP, an HLS playlist or a bundled clip
- Ortho and point cloud upload, with a tiling pipeline and a viewer
- DJI FlightHub and Dock integration, and live video
- VMS integration, live playback, PTZ control and AI analytics on the stream
- One audit trail across telemetry, fleet and manual changes, streamed live to the browser
- Asset import from GeoJSON, CSV and IFC, or drawn straight on the map
- Login, SSO and role-based access
- Data separation per contractor inside one site
- Several pits under one company, instead of one site per tenant
- A tablet layout for use in the field
What a pilot looks like
A pilot is scoped around one site and the feeds it can already give: no rip-and-replace, and no data leaving your systems that you have not agreed to.
Your site on the map
Bring a boundary, an asset list and whatever terrain or survey you hold. We stand the site up in the console and hand you the link.
One real feed
Point one live source at it: an FMS export, a telematics API, a sensor gateway, or a CCTV list. The broker boundary is already built for it.
The rules you run
We model your zones, inspection programs and reporting, then agree which in-build items move up the queue for your operation.
See your own site on the map
Enterprise pilots are open now. Walk through the console with your own estate, plant or pit in mind, and tell us which in-build item should come first.